See what flows
between your systems
Your CRM talks to your support desk, which talks to core banking. TraceTap maps those connections, learns the shape of the data on each one, and tells you the moment something diverges.
Nothing sensitive reaches us. Sampled traffic is redacted inside the probe, on your own machine — and a field nobody has classified is masked by default.
Taps the systems you already run
Our own traffic, traced as it happens
This is tracetap.net right now: each request in the last hour, from the visitor's country to the CDN edge that answered it, and on to our origin in Helsinki.
It comes from our CDN logs as counts per country and edge — no addresses, no paths, no payloads. The shape of the traffic, never its contents.
- Requests / hour
- —
- Countries
- —
- CDN edges
- —
We never see your customers' data
Every other tool in this category asks you to ship production payloads to a vendor. TraceTap does the opposite: the probe transforms the sample on your own hardware, before it goes anywhere.
The default for a field nobody has classified is to mask it. A body the probe cannot parse is withheld entirely — because a body it could not inspect is a body it could not redact.
Redacted at the source
Rules run in the probe, on your machine. Not in our cloud.
Encrypted end to end
AES-256-GCM under a key only your project holds.
Realistic, not blank
Deterministic fakes: valid IBANs, Luhn-safe cards, stable across systems.
A human approves
AI can suggest. Nothing is published until a person signs it off.
Four steps to a landscape that watches itself
From an empty canvas to rules your probes enforce, without writing a schema by hand.
- 01
Map the landscape
Draw every system and the links between them on a canvas. Say what each link speaks — JSON, XML, SOAP, gRPC — and how you can tap it.
- 02
Install a probe
A proxy binary, a servlet filter, ASP.NET Core middleware, WSGI, Go — whatever fits. One in every N messages is sampled; the rest are only counted.
- 03
Watch it learn
TraceTap builds a field-by-field picture of every endpoint. Anything that does not match what it learned becomes a divergence in the Pulse feed.
- 04
Approve, then publish
Say what each field is, in plain language, with a live before-and-after. Approving publishes rules the probes enforce locally from then on.
Everything, from the map to the payload
Screenshots from the real product, not a mock-up.
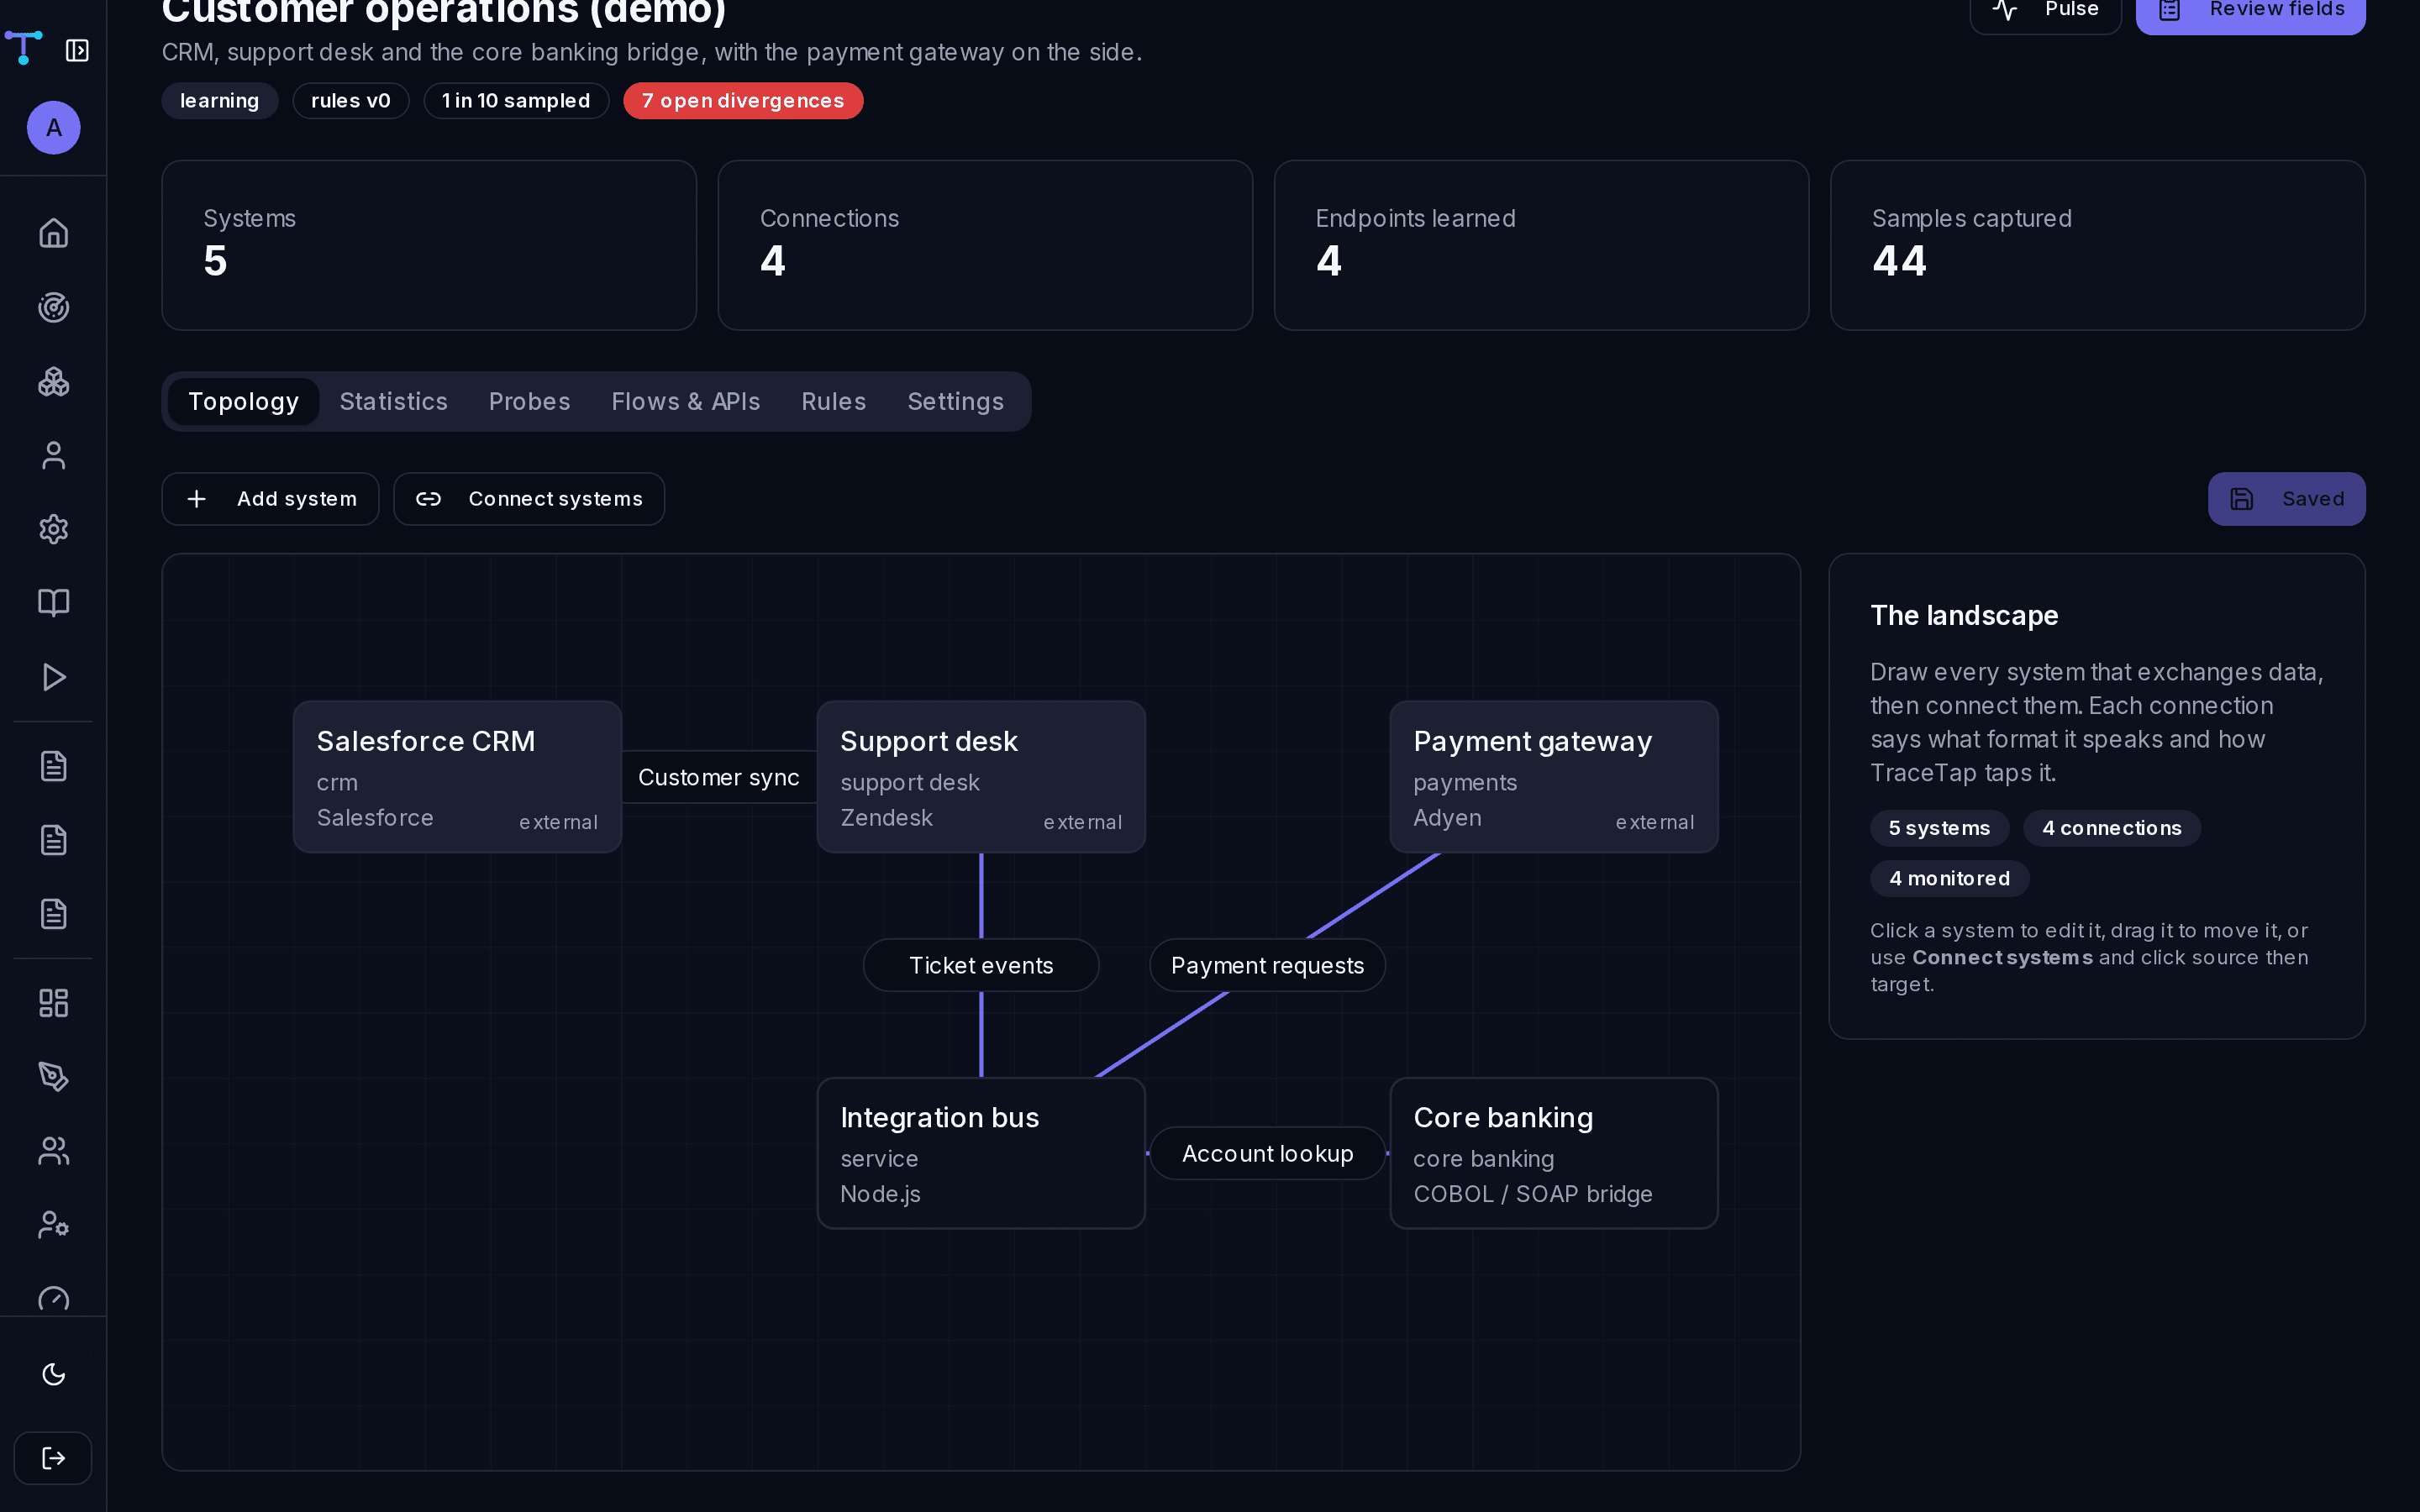
Topology
Draw the landscape once
Every system, every link, and how each one is tapped. Drag a box, connect two systems, pick the format on the wire. The map is what everything else hangs off.
- JSON, XML, SOAP and gRPC on any link
- Marks which links have no probe reporting
- Saves the whole canvas in one action
Review
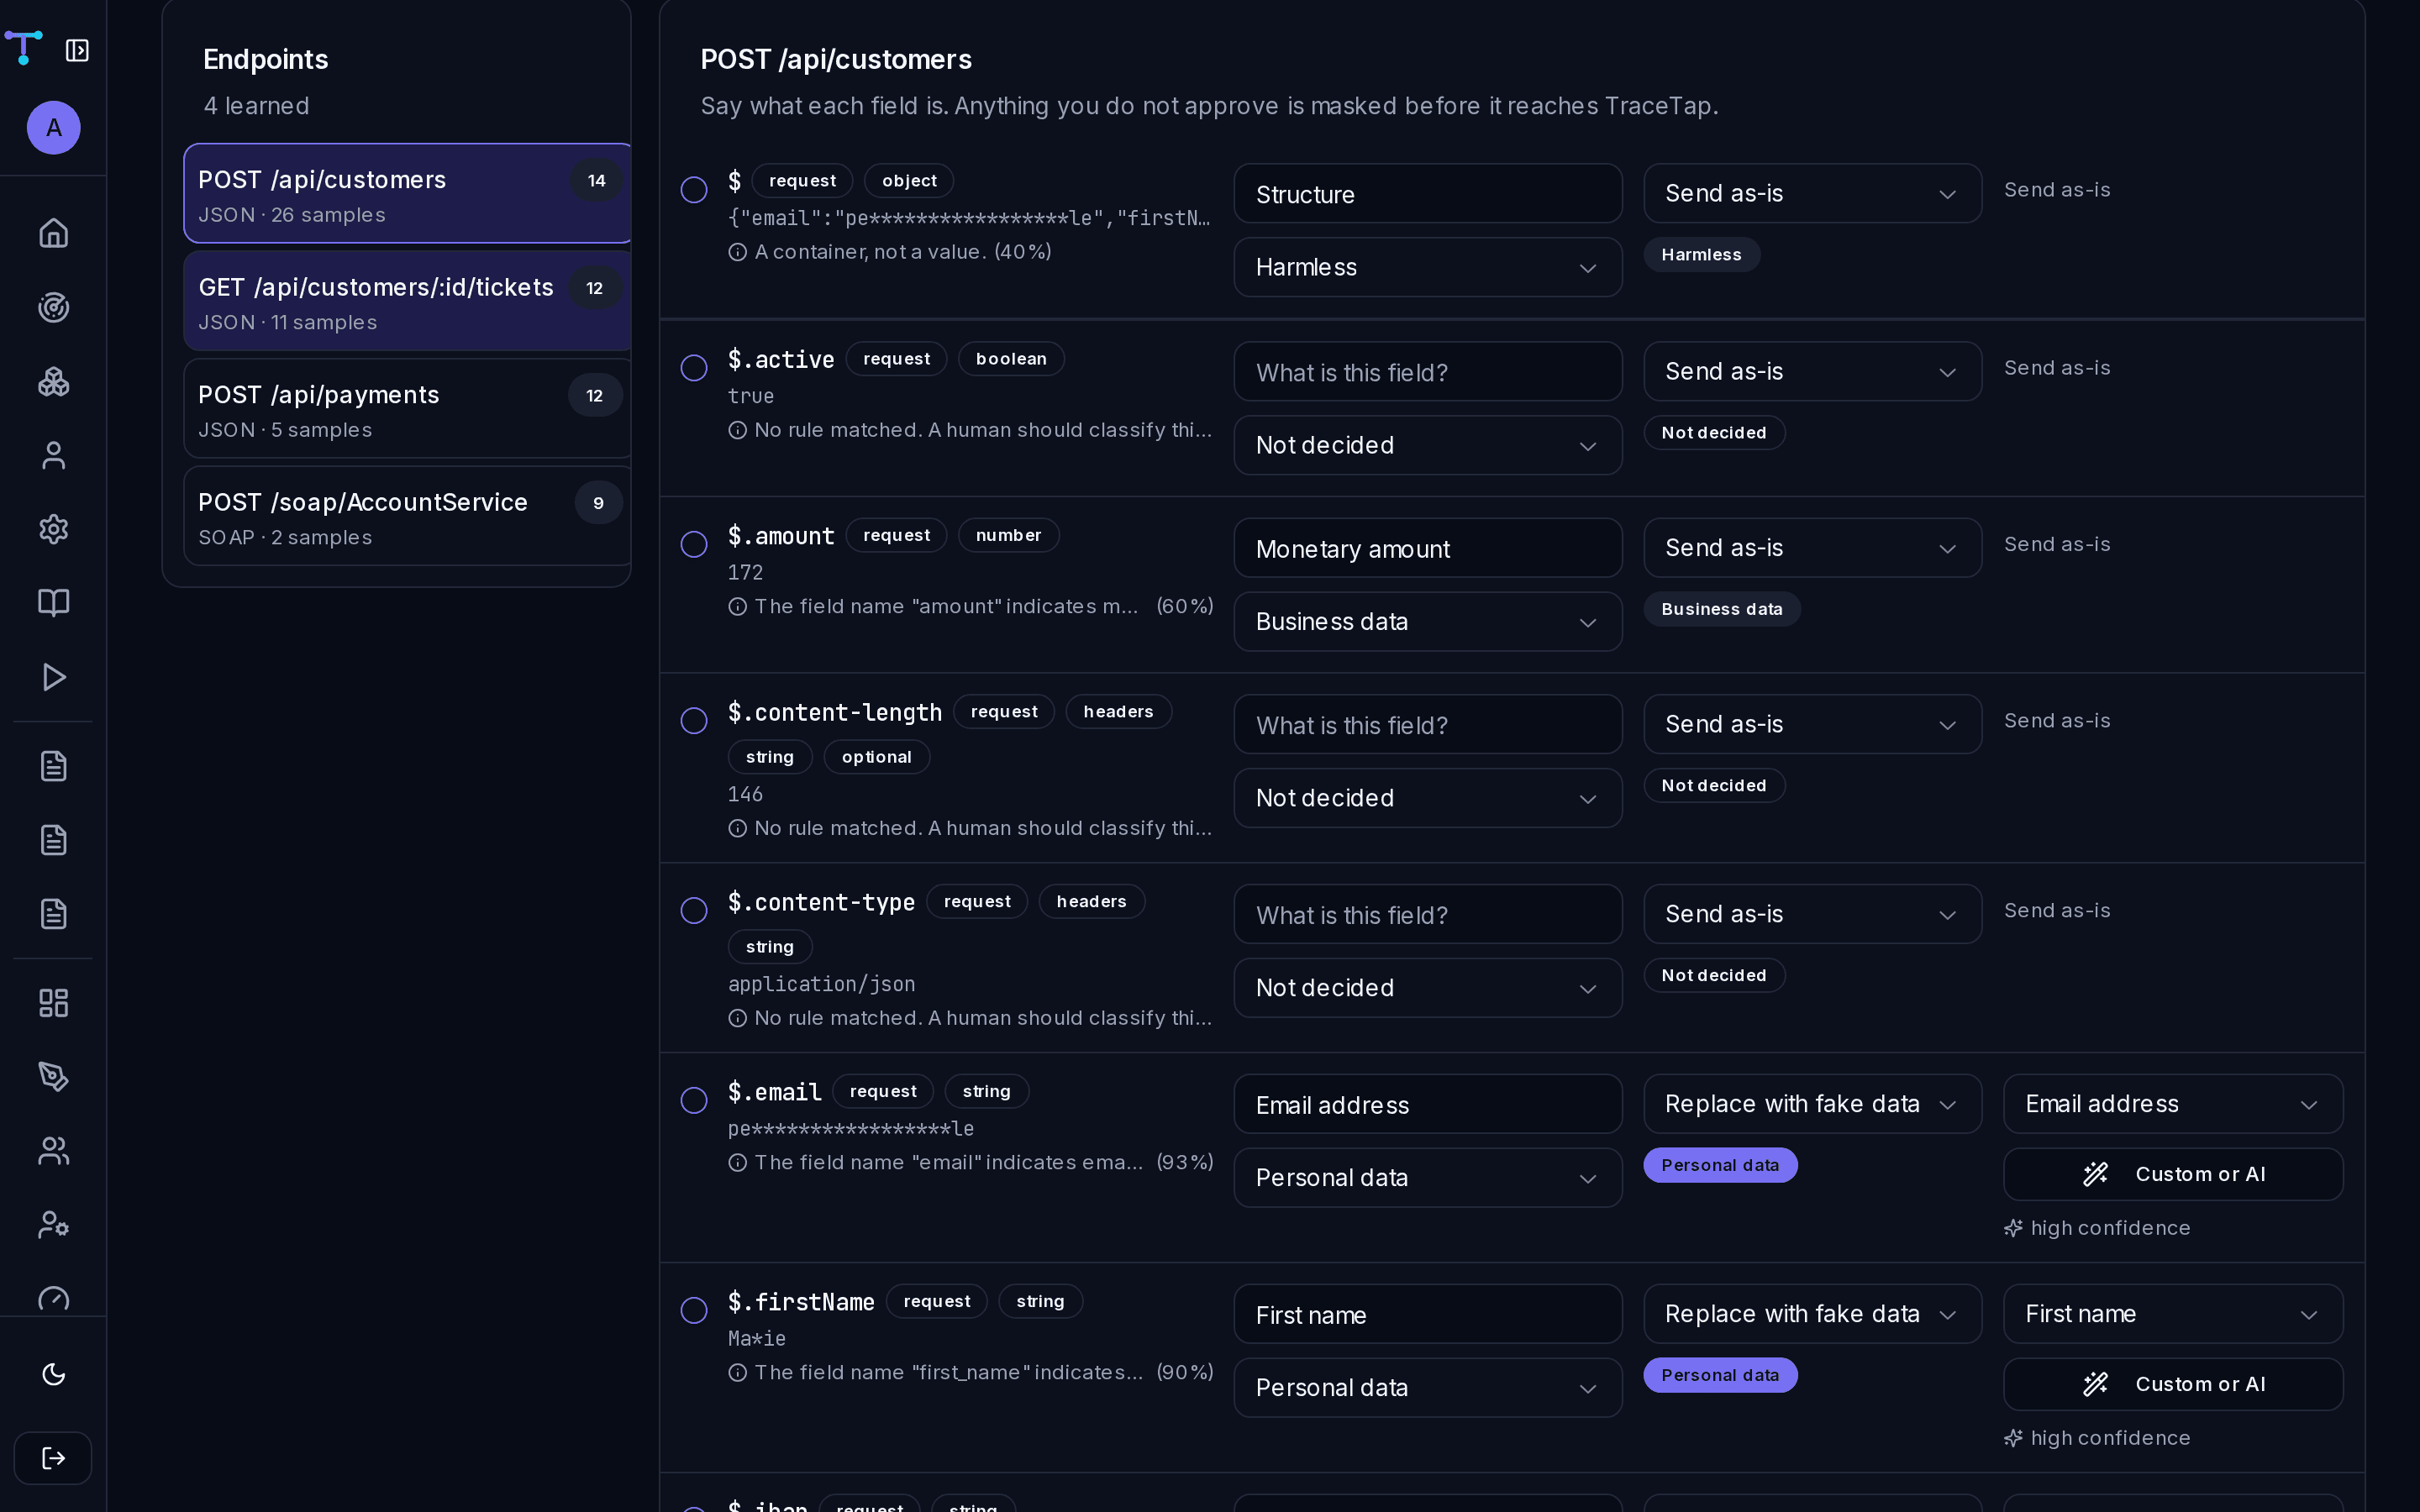
Decide what every field is — and see it happen
A non-technical reviewer works down a list in plain language. The before-and-after re-renders as they go, so "is this personal data?" is answered by looking, not by guessing.
- Built-in heuristics flag the obvious cases
- Ask an AI to classify a batch — you still approve
- Custom generators in JavaScript, with a live preview
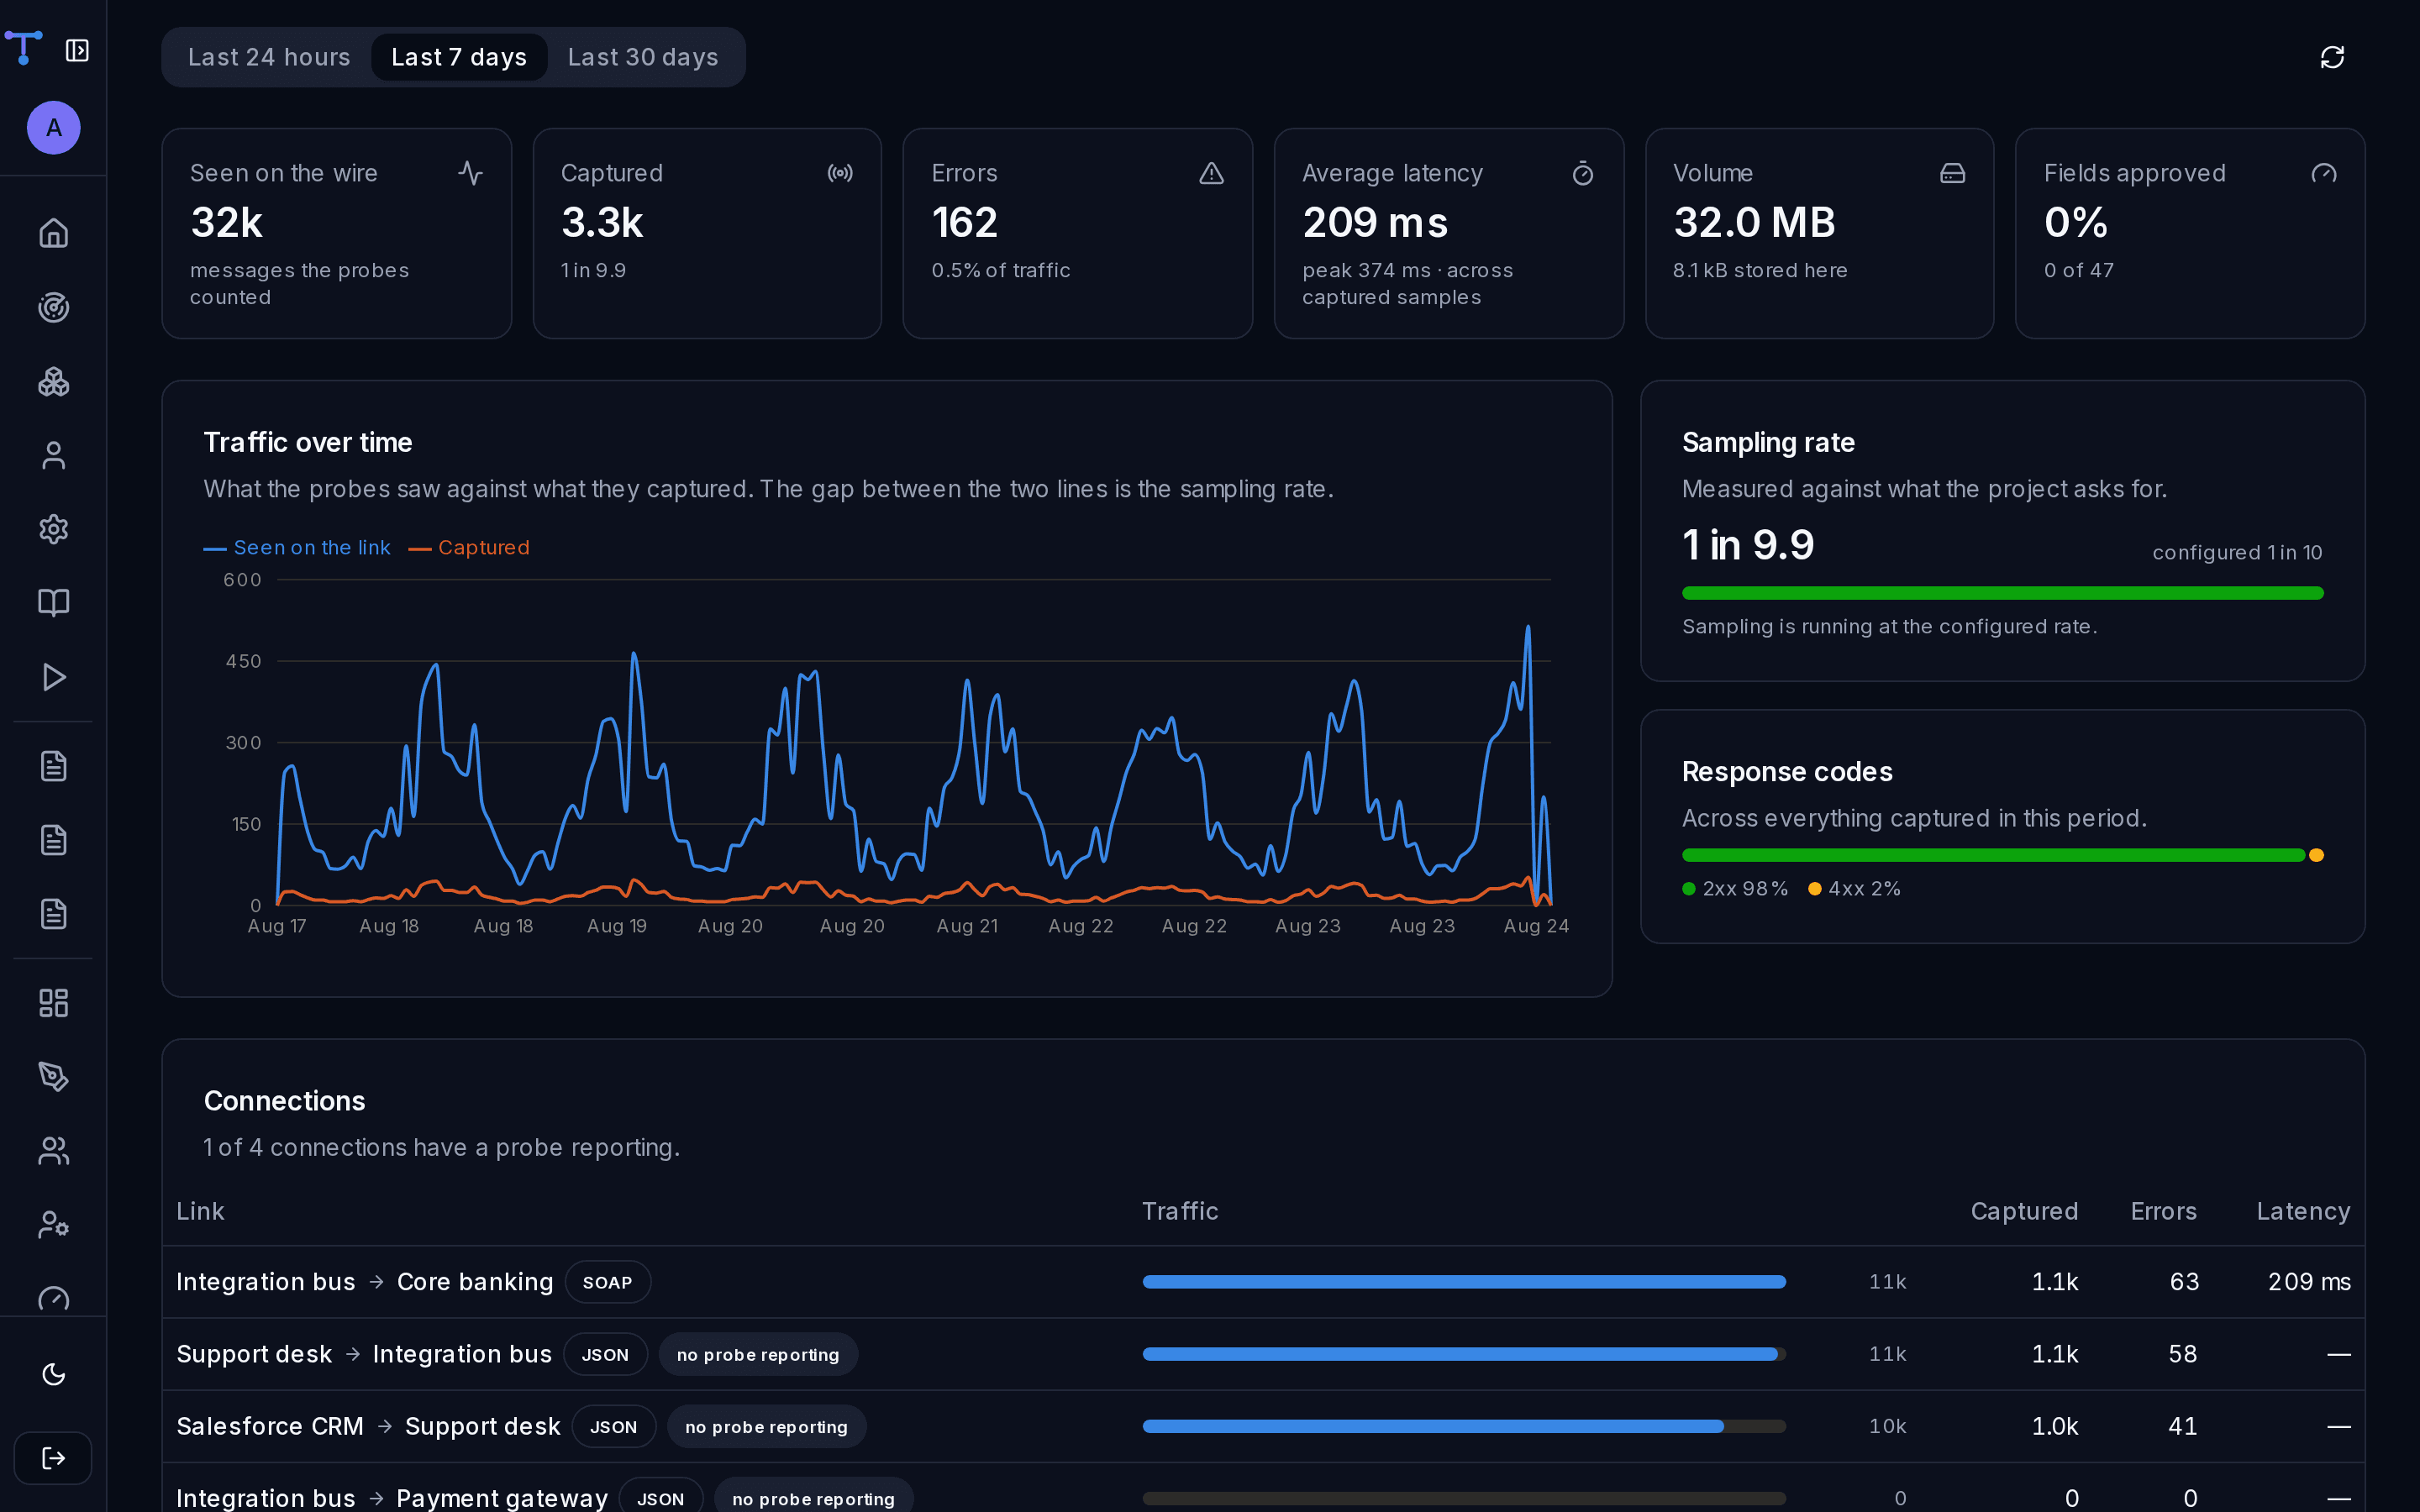
Statistics
Real traffic volume, not a sample count
Probes count every message they see, not just the ones they keep — so the numbers are the traffic, not the sampling rate. Estimates are labelled as estimates.
- Measured throughput against what was captured
- Per connection, per system, per probe, per endpoint
- Latency, error rate and response mix
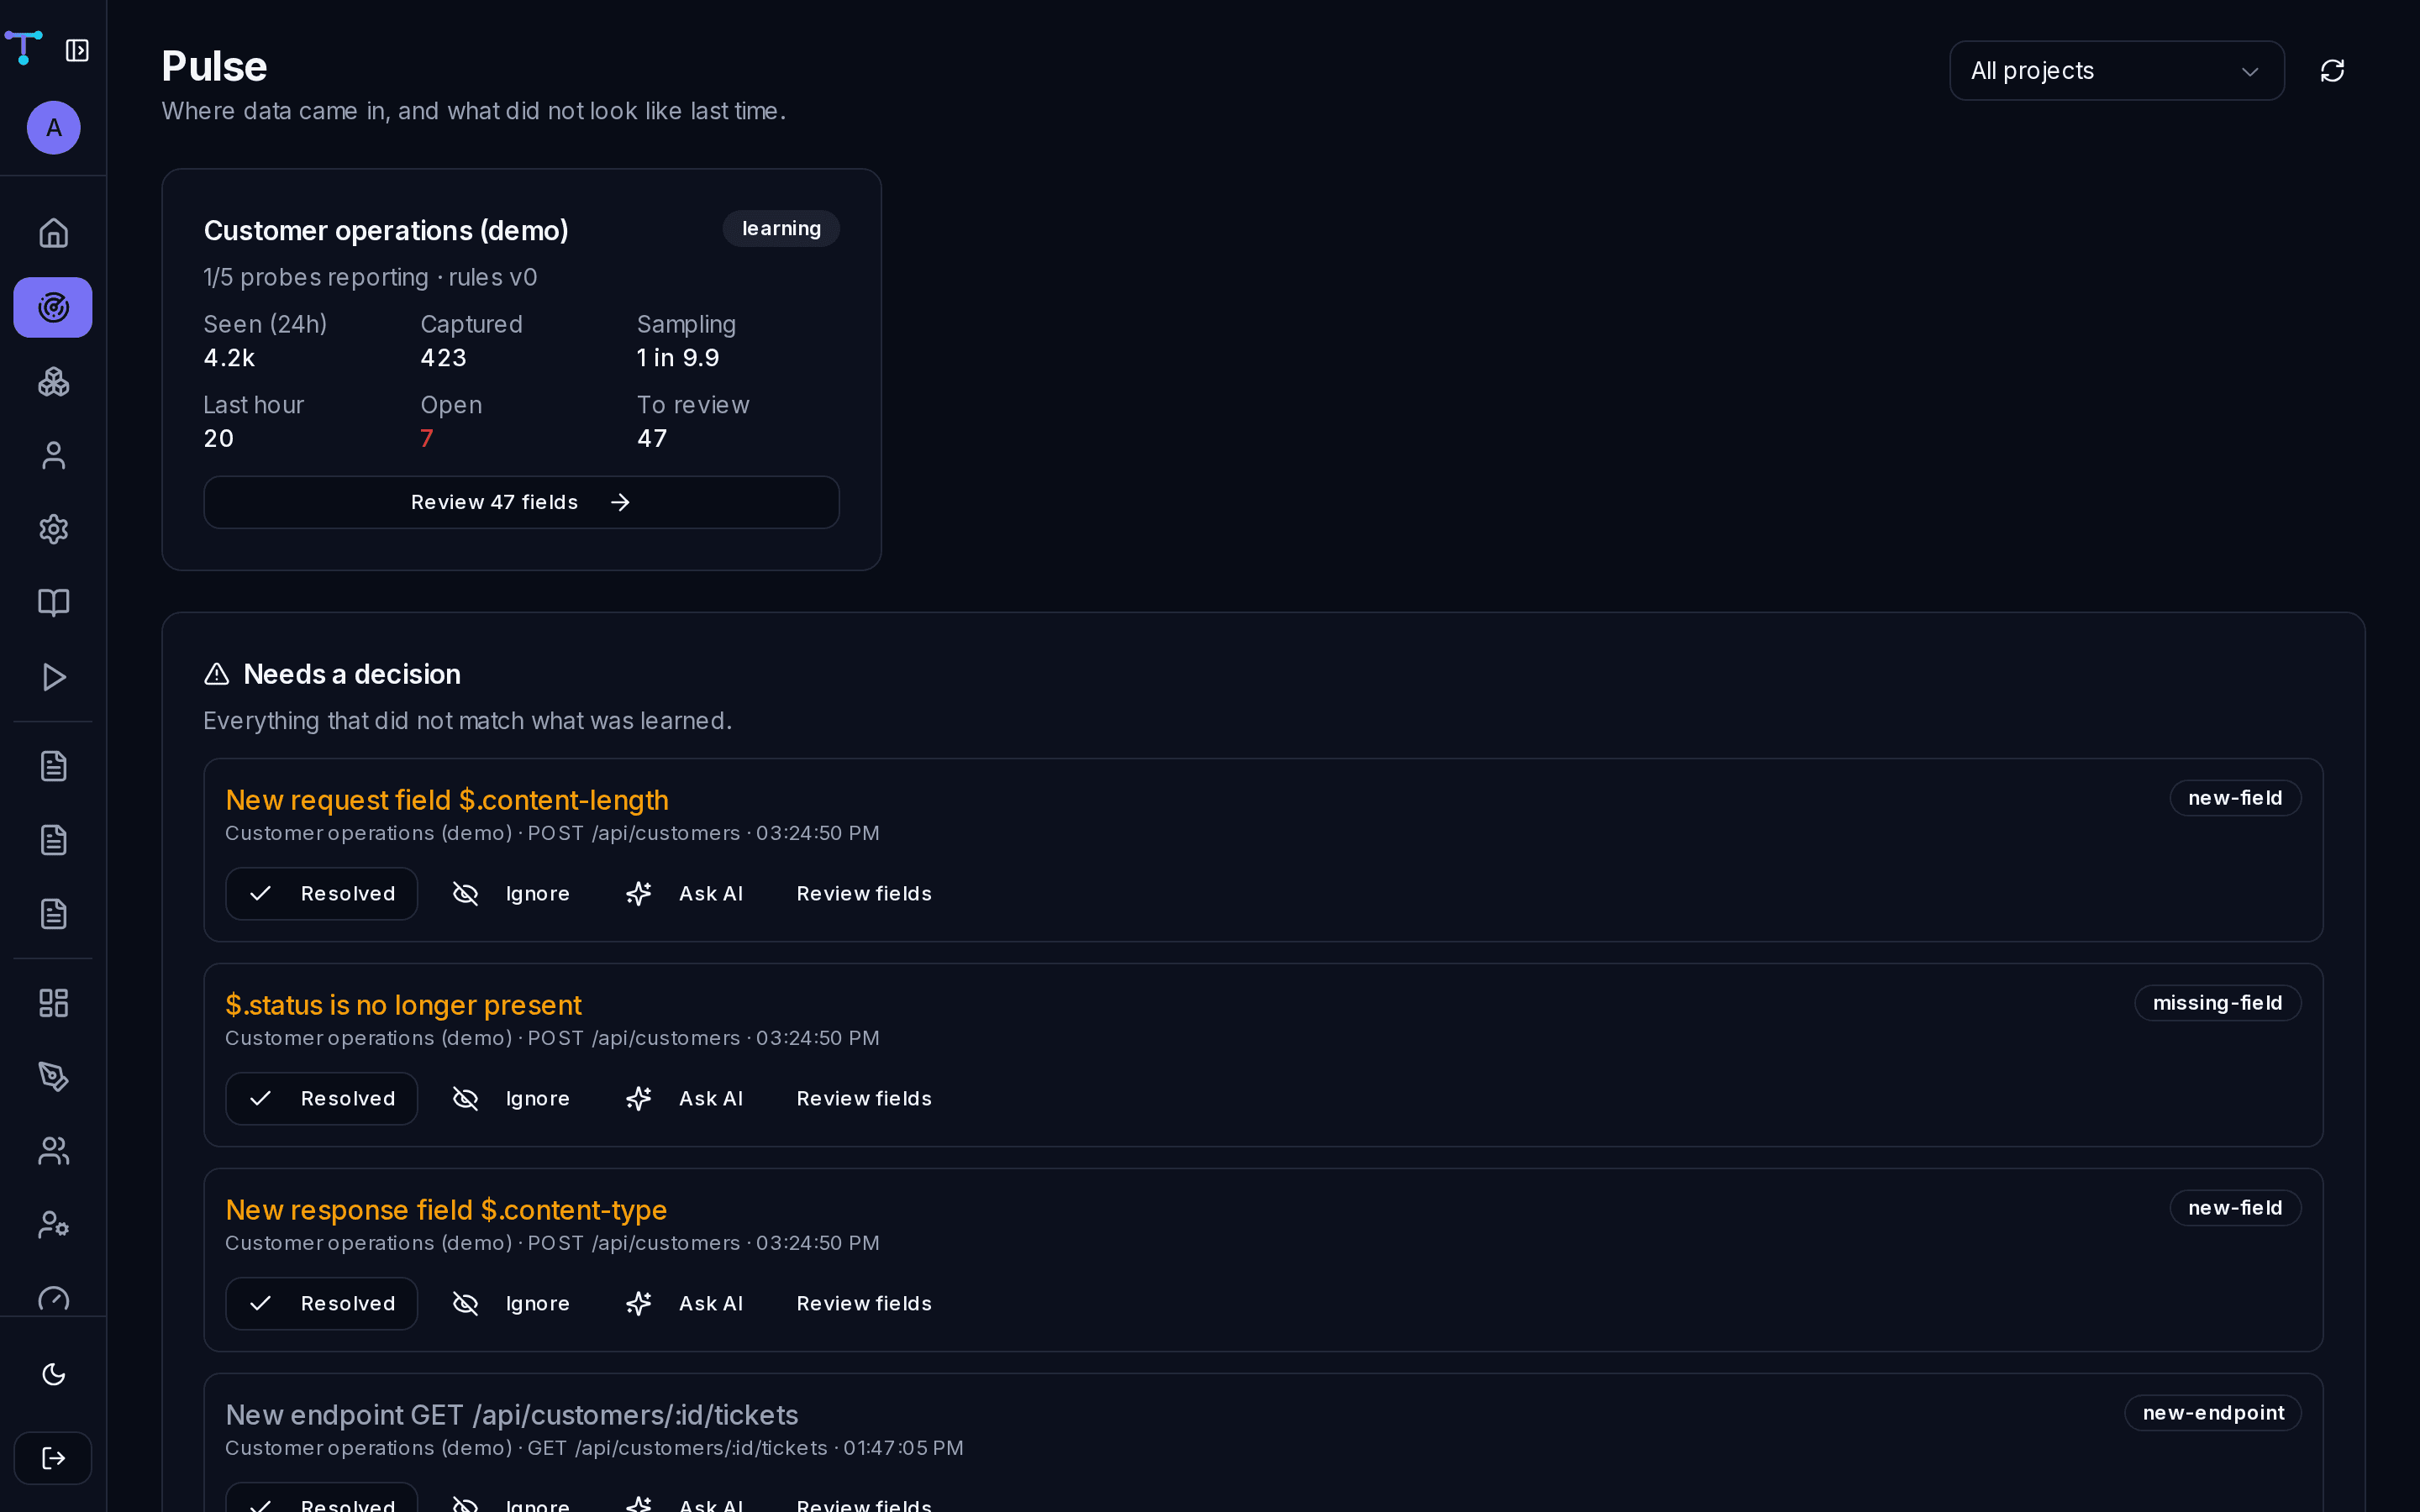
Pulse
Told the moment something changes
A new field, a changed type, a field that vanished, a 5xx that never used to happen. Each one arrives once, with the evidence attached — and email that never becomes a firehose.
- One item per change, not one per sample
- AI can explain a divergence and suggest a fix
- Resolve, ignore, or jump straight to the field
A probe for the stack you actually have
Including the ones nobody else supports. If the system is twenty years old and you cannot change a line of it, put the proxy in front and point the client at that.
Not one agent carries a third-party dependency — no Jackson in your WAR, no packages in your virtualenv, nothing new in your go.mod.
Java servlet filter
Tomcat · JBoss EAP · WildFly · Jetty · WebSphere · Spring Boot
Java 8+, one JAR, zero dependencies
ASP.NET Core
Kestrel · IIS in-process and out-of-process
One line in Program.cs
Python WSGI / ASGI
Django · Flask · FastAPI · Starlette · Pyramid
Wrap the application object
Go net/http
stdlib mux · chi · gorilla/mux · echo · gin
Wraps any http.Handler
Proxy binary
Anything you cannot change
Sits in between, passes bytes through
Node libraries
Express · Next.js · fetch() · axios
Two lines, no redirect needed
Find out what your systems are really saying to each other
Map a landscape, install one probe, and watch the first divergence arrive. Your data never leaves your network in the clear.